
Morgan Stanley (MS) is a global financial-services firm built around Institutional Securities, Wealth Management and Investment Management. Its equities, fixed-income and investment-banking franchises capture active capital markets, while recurring asset-management fees and net interest income make Wealth Management the stabilizing engine. That balance broadens earnings sources, although results remain sensitive to market activity, asset values and client risk appetite.
The latest quarter showed the integrated model operating at unusually high intensity. Morgan Stanley Q2 2026 net revenues rose 27.1% to $21.348 billion, diluted EPS increased 62.4% to $3.46, Institutional Securities revenue reached $11.040 billion and Wealth Management added a record $148.1 billion in net new assets. The investment debate now centers on how much of that performance can persist after favorable trading and deal conditions normalize.
The MS stock forecast for 2026 now centers on two competing views:
- The integrated-firm case: sustained deal activity, market-share gains and recurring wealth inflows keep ROTCE above 20% and support a higher valuation.
- The normalization case: trading revenue, investment banking and asset values cool together, reducing operating leverage after a record quarter.
This guide breaks down the MS stock forecast, 2026 price scenarios, key risks and analyst outlooks, drawing on Morgan Stanley's July 15 Q2 2026 earnings release, SEC filing and market data through September 4, plus how to trade MS stock futures on BingX TradFi with USDT collateral.
Top 5 Things for Morgan Stanley Investors to Know in September 2026
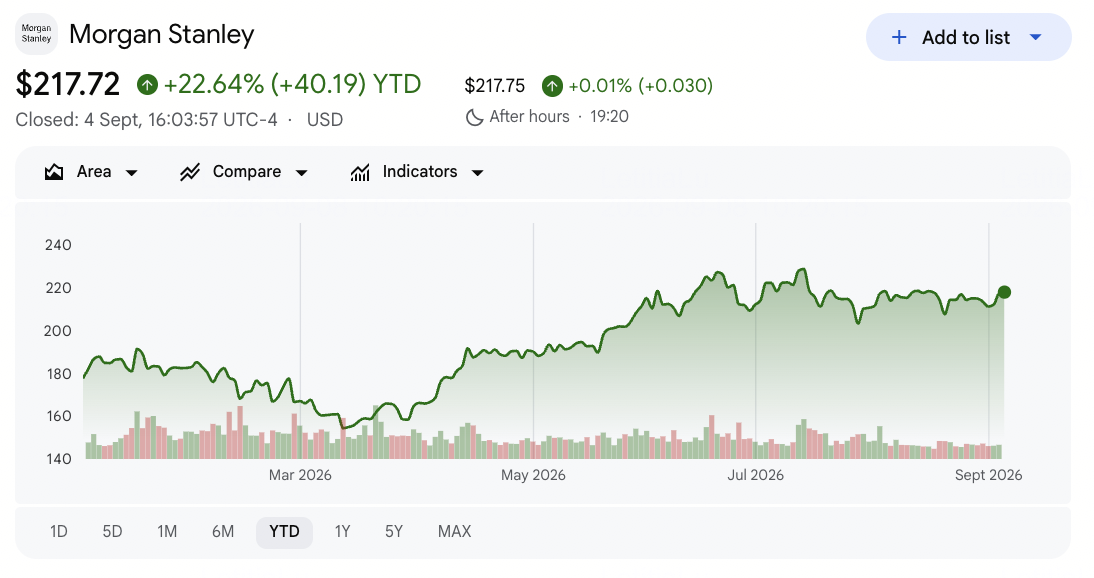
- MS closed at $217.72 after gaining about 22.6% YTD: The stock finished roughly 6.3% below its $232.25 52-week high, showing that investors had already repriced the firm around stronger trading, deal activity and wealth flows. Further upside increasingly depends on earnings durability rather than another simple recovery from the 2025 year-end close.
- Q2 net revenues reached a record $21.348 billion, up 27.1%: Revenue exceeded the roughly $19.5 billion consensus by about $1.85 billion, while pre-tax income increased 59.0% to $7.348 billion. The gap between revenue and profit growth confirms that stronger client activity translated into substantial operating leverage.
- Equities revenue jumped 69.3% to a record $6.300 billion: Institutional Securities generated $11.040 billion, up 44.4%, and Investment Banking revenue rose 58.2% to $2.437 billion. These figures establish capital markets as the main near-term upside driver, as well as the largest normalization risk.
- Wealth Management added a record $148.1 billion in net new assets: The business produced $8.856 billion in revenue and a 30.5% pre-tax margin, while total client assets across Wealth and Investment Management reached $10 trillion. Recurring fees give the firm a counterweight when transaction-heavy businesses slow.
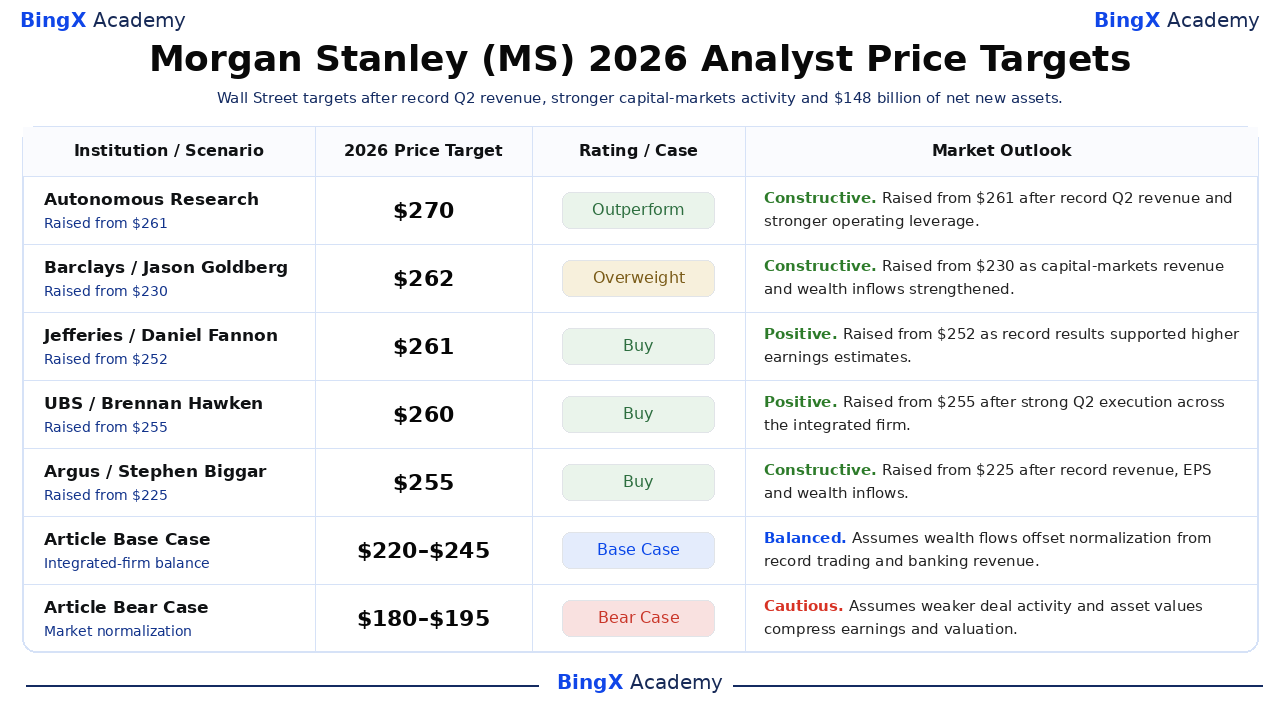
- Named analyst targets now stretch from $195 to $270: Autonomous Research holds the selected high at $270, while JPMorgan's $195 Neutral target sits below the $217.72 reference close. The dispersion reflects disagreement over whether 26.6% ROTCE represents a repeatable integrated-firm return or a cyclical peak.
What Is Morgan Stanley (MS)?

Morgan Stanley (MS) is a U.S.-based global financial services firm serving corporations, governments, institutions, and individual investors. Its three main businesses are Institutional Securities, Wealth Management, and Investment Management. Institutional Securities covers investment banking, underwriting, equities, and fixed-income trading; Wealth Management provides brokerage, financial advice, lending, and workplace services; and Investment Management offers public- and private-market strategies. Revenue comes from advisory and underwriting fees, trading, asset-management fees, lending spreads, and investment income.
Its strategy is increasingly centered on linking these businesses through Morgan Stanley’s Integrated Firm model. The company uses institutional research, capital-markets relationships, workplace channels, and wealth-management services to deepen relationships with both corporate clients and affluent investors. The acquisitions of E*TRADE and Eaton Vance expanded its self-directed brokerage, workplace, and asset-management reach, while client assets reaching roughly $10 trillion give Morgan Stanley a much larger base for recurring fees, lending, cross-selling, and technology investment
Read More: Top Financial Services and Fintech Stocks to Buy in 2026 Amid Agentic AI, Stablecoin Rails Shift
Morgan Stanley (MS) Q2 2026 Earnings Overview: Record Revenue, EPS and Wealth Flows
Morgan Stanley delivered $21.348 billion in Q2 revenue versus roughly $19.5 billion expected, diluted EPS of $3.46 versus about $2.77 expected and $5.581 billion in net income. Equities revenue rose 69.3% to $6.300 billion, while Wealth Management added $148.1 billion in net new assets. ROTCE reached 26.6%, leaving investors to judge how much record capital-market activity can persist.
Read More: Morgan Stanley (MS) Q2 2026 Earnings Overview: $21.35B Revenue Beat Drives a 0.39% Price Rally
|
Financial Metric |
Guidance / Consensus |
Reported / Actual |
Surprise |
|
Q2 2026 net revenues |
$19.5B consensus |
$21.348B |
Beat. About $1.85B above consensus; up 27.1% YoY. |
|
Q2 diluted EPS |
$2.77 consensus |
$3.46 |
Beat. $0.69 above consensus; up 62.4% YoY. |
|
Q2 net income applicable to MS |
— |
$5.581B |
Improved. Up 57.7% from $3.539B. |
|
Q2 pre-tax income |
— |
$7.348B |
Improved. Up 59.0% from $4.622B. |
|
Institutional Securities revenue |
— |
$11.040B |
Record. Up 44.4% from $7.643B. |
|
Equity revenue |
— |
$6.300B |
Record. Up 69.3% year over year. |
|
Investment Banking revenue |
— |
$2.437B |
Accelerated. Up 58.2% year over year. |
|
Wealth Management revenue |
— |
$8.856B |
Record. Up 14.1% with a 30.5% pre-tax margin. |
|
Wealth Management net new assets |
— |
$148.1B |
Record. Increased from $59.2B a year earlier. |
|
Return on tangible common equity |
— |
26.60% |
Expanded. Up from 18.2% a year earlier. |
|
Standardized CET1 ratio |
— |
14.80% |
Strong. Preserved capital flexibility for investment and returns. |
- Revenue of $21.348 billion grew 27.1% and beat consensus by about $1.85 billion: The firm generated $16.792 billion a year earlier, so the record reflected broad expansion rather than a narrow comparison effect. The result raised the earnings base, although it also made future year-over-year comparisons more demanding.
- Diluted EPS of $3.46 exceeded the $2.77 estimate by $0.69: EPS rose from $2.13 as net income increased 57.7% to $5.581 billion. The larger bottom-line gain relative to revenue shows the power of operating leverage when trading, underwriting and advisory activity strengthen together.
- Institutional Securities revenue rose 44.4% to $11.040 billion: Equities increased 69.3% to $6.300 billion, Investment Banking rose 58.2% to $2.437 billion and Fixed Income grew 12.6% to $2.455 billion. The mix confirms broad capital-markets momentum, though equities contributed the most exceptional growth.
- Wealth Management revenue increased 14.1% to $8.856 billion: Net new assets reached $148.1 billion versus $59.2 billion a year earlier, and the segment delivered a 30.5% pre-tax margin. Asset gathering strengthens the recurring fee base that can cushion transaction-revenue volatility.
- ROTCE expanded to 26.6% from 18.2%: The expense efficiency ratio improved to 65% from 71%, while the standardized CET1 capital ratio remained 14.8%. Those figures support capital flexibility and shareholder returns, though sustained returns require earnings to hold as market conditions normalize.
Morgan Stanley (MS) Stock 2026 Investment Outlook: $270 Bull Target vs. $180 Bear Floor
The central test is whether recurring Wealth Management economics and new assets can offset eventual normalization in record capital-markets revenue. The following ranges are BingX Academy editorial scenarios rather than Wall Street forecasts.
The Bull Case: Strong Investment Banking and Trading Push MS Toward $270
The Bull Case assumes investment-banking activity remains strong, equities revenue holds market share, and Wealth Management continues attracting more than $100 billion of quarterly net new assets. Revenue grows faster than expenses, keeping ROTCE near or above 25% and the efficiency ratio close to 65%.
A move toward $260 to $270 would require healthy deal completions, equity issuance, and client trading without a major deterioration in credit or asset values. Continued EPS upgrades and Wealth Management margins near 30% would provide the clearest confirmation.
The Base Case: Steady Wealth Management Growth Keeps MS Between $220 and $245
The Base Case assumes capital-markets revenue normalizes from Q2 highs, while Morgan Stanley’s larger wealth-management asset base continues supporting fee growth and lending income. ROTCE stays above 20%, net new assets remain positive, and expense growth stays controlled.
Under this scenario, MS could trade mainly between $220 and $245. Quarterly EPS near $3, Wealth Management margins around 30%, and stable client assets would support the range, while weaker inflows or estimate cuts would pressure the upper end.
The Bear Case: Weaker Markets and Slower Deal Activity Pull MS Toward $180
The Bear Case assumes lower volatility reduces trading revenue, M&A activity slows, and falling markets pressure fee-based client assets. Institutional Securities revenue then falls from the Q2 level of $11.040 billion, while technology and regulatory costs remain relatively fixed.
A move toward $180 to $195 would become more likely if ROTCE falls below 18%, net new assets slow materially, or quarterly EPS drops below $2.50. Morgan Stanley could remain profitable, but weaker earnings momentum and multiple compression would pressure the stock.
MS Stock Price Forecasts for 2026 By Wall Street Analysts
The six selected actions are dated, named third-party targets presented from highest to lowest. They range from $195 to $270, while the broader consensus sits around $237. The final two rows are BingX Academy editorial scenarios rather than Wall Street forecasts.
|
Institution / Scenario |
2026 Price Target |
Rating / Case |
Market Outlook |
|
Autonomous Research |
$270 |
Outperform |
Constructive. July 16: raised from $261. Raised the target after record Q2 revenue and stronger operating leverage. |
|
Barclays |
$262 |
Overweight |
Constructive. July 16: raised from $230. Raised the target as capital-markets revenue and Wealth Management inflows exceeded expectations. |
|
Jefferies |
$261 |
Buy |
Positive. July 16: raised from $252. Raised the target as record results supported higher earnings estimates. |
|
UBS |
$260 |
Buy |
Positive. August 3: raised from $255. Raised the target while maintaining Buy following strong Q2 execution. |
|
Argus |
$255 |
Buy |
Constructive. July 16: raised from $225. Raised the target after record revenue, EPS and Wealth Management inflows. |
|
JPMorgan |
$195 |
Neutral |
Cautious. July 16: raised from $187. Raised the target modestly while retaining Neutral as valuation balanced stronger earnings. |
|
Article Base Case |
$220–$245 |
Base Case |
Balanced. Assumes wealth flows offset normalization from record trading and banking revenue. |
|
Article Bear Case |
$180–$195 |
Bear Case |
Cautious. Assumes weaker deal activity and asset values compress earnings and valuation. |
How to Trade Morgan Stanley (MS) Stock on BingX
Trade Morgan Stanley's capital-markets momentum, Wealth Management asset growth and profitability outlook using BingX TradFi and BingX AI tools. Because MS can react sharply to market volatility, deal activity, earnings and interest-rate expectations, traders should define both the catalyst and risk limits before entering a position.
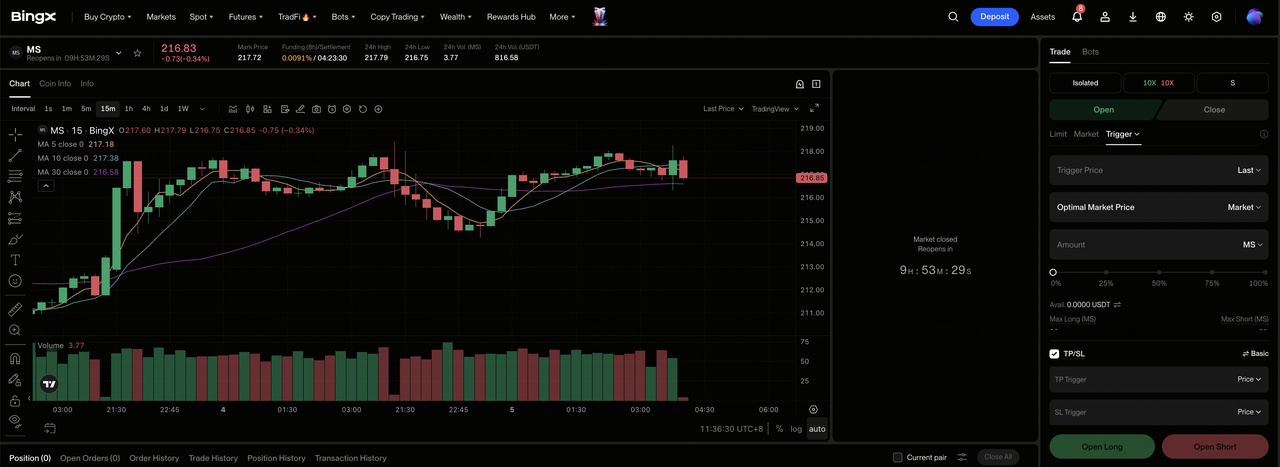
Step 1: Access BingX TradFi. Sign up and navigate to the specialized TradFi section on the BingX exchange dashboard.
Step 2: Select Morgan Stanley (MS). Search for and select the MS-USDT perpetual futures contract.
Step 3: Choose your direction. Select Open Long if capital-markets activity remains strong and wealth inflows support recurring fees. Select Open Short if trading normalization, weaker deal activity or falling asset values reduce earnings expectations.
Step 4: Select leverage and margin mode. Choose Isolated or Cross-Margin based on your risk tolerance. The stock's roughly 23% YTD gain shows why conservative leverage and clear position sizing are important.
Step 5: Execute strict risk protocols. Set Take-Profit and Stop-Loss (TP/SL) levels before or immediately after entering the trade. MS can react quickly to earnings, deal announcements, trading conditions, interest rates and changes in client assets.
Top 5 Risks to Watch for Morgan Stanley Investors in 2026
Morgan Stanley's integrated model diversifies revenue, although record results and a higher share price leave the investment case sensitive to cyclical normalization and execution.
- Equities revenue rose 69.3% to $6.300 billion: Favorable volatility and client activity supported a record quarter. A return to quieter markets could reduce trading revenue faster than compensation and technology costs adjust, compressing earnings and ROTCE.
- Investment Banking revenue increased 58.2% to $2.437 billion: Advisory and underwriting depend on completed transactions, issuance conditions and executive confidence. Delayed M&A closings or weaker capital formation would reduce fee revenue and estimate momentum.
- $148.1 billion of net new assets creates a demanding comparison: The prior-year figure was $59.2 billion. Slower gathering, client withdrawals or market declines would reduce fee-based assets and weaken the recurring revenue meant to stabilize capital-markets volatility.
- A 26.6% ROTCE may represent a cyclical high: ROTCE rose from 18.2% as the efficiency ratio improved to 65%. If revenues normalize and expenses remain elevated, returns could fall quickly and cause investors to assign a lower earnings multiple.
- MS traded at about 17.6 times trailing earnings at $217.72: The multiple rests on expectations for durable wealth growth and above-cycle profitability. Regulatory costs, market losses or simultaneous weakness across trading and asset values could pressure both earnings and valuation.
Final Thoughts: Should You Invest in Morgan Stanley in 2026?
Morgan Stanley's Q2 results showed the upside of its integrated model: revenue rose 27.1% to $21.348 billion, EPS increased 62.4% to $3.46, equities revenue reached $6.300 billion and Wealth Management added $148.1 billion in net new assets. A 26.6% ROTCE and 65% efficiency ratio confirmed unusually strong operating leverage.
The $220 to $245 Base Case assumes wealth flows and recurring fees offset normalization from record capital-markets revenue. The $260 to $270 Bull Case requires sustained deal activity and returns near 25%, while the $180 to $195 Bear Case reflects weaker trading, asset values and estimate revisions. Investors should track net new assets, Wealth Management margins, deal completions and ROTCE before extrapolating Q2's records.
Risk Reminder: These MS scenarios are conditional research estimates, not investment advice or guaranteed returns. Morgan Stanley shares and MS-USDT perpetual contracts can lose value, and leveraged positions may be liquidated. Review current market data, company filings and BingX terms independently before taking risk.
Related Reading
- Top Financial Services and Fintech Stocks to Buy in 2026 Amid Agentic AI, Stablecoin Rails Shift
- Goldman Sachs (GS) Price Prediction 2026: Record Earnings, IPO Boom and a Path Toward $1,195
- JPMorgan Chase (JPM) Price Prediction 2026: Fortress Balance Sheet or Valuation Ceiling?
- Mastercard (MA) Price Prediction 2026: Can Cross-Border Growth Push MA Toward $760?
- Visa (V) Stock Forecast 2026: Can Cross-Border Payment Growth Push V Toward $430?
