In trading, the strongest trends often hide early signs of weakness. A market may print new highs, yet close the session with a small-bodied candle and a long lower shadow. Is it just a routine pullback, or the beginning of a reversal?
The Hanging Man candlestick pattern is one such early warning signal. When properly understood and confirmed, it can help traders anticipate bearish reversals before momentum fully shifts. But identifying the shape alone is not enough. Success requires context, confirmation, and disciplined risk management.
This guide breaks down the structure, psychology, confirmation rules, and trading framework needed to turn the Hanging Man into a structured trade setup.
What Is the Hanging Man Candlestick Pattern in Crypto Trading?
The Hanging Man is a single candlestick pattern that appears after a sustained upward trend. It signals that buying momentum may be weakening and that sellers are beginning to challenge bullish control.
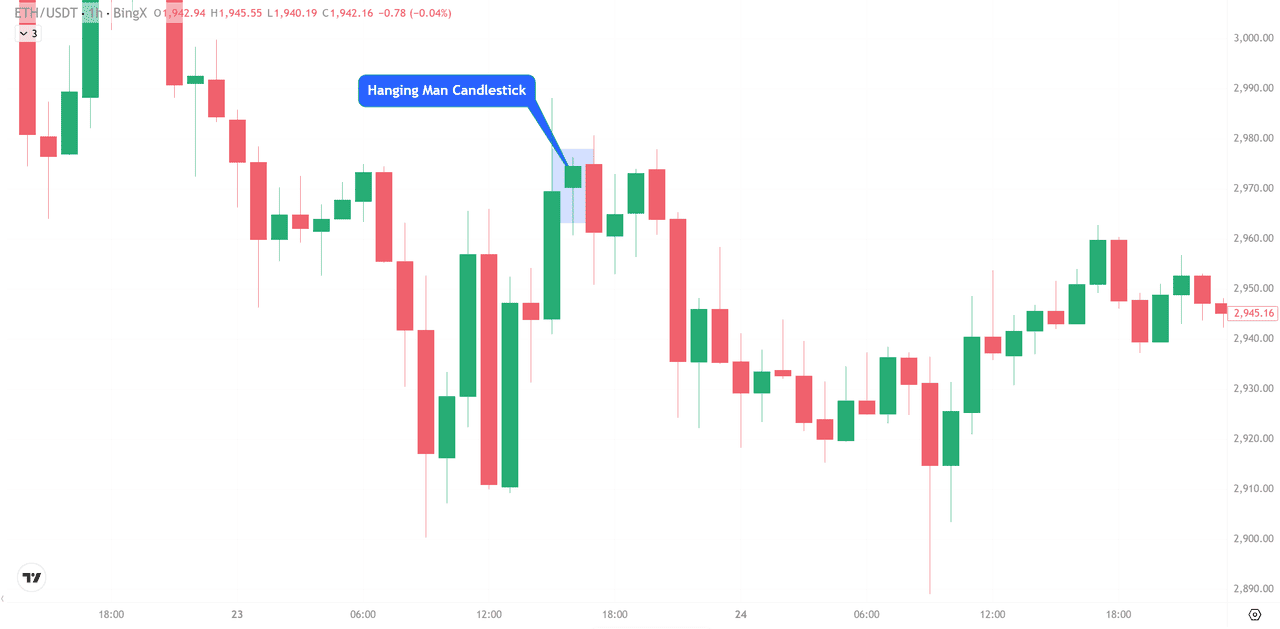
Ethereum (ETH/USDT) Price Chart - Source: BingX
Although it looks identical to the bullish Hammer pattern, its meaning is entirely dependent on market context. While a Hammer forms after a decline and signals potential bullish reversal, the Hanging Man forms near market highs and signals potential bearish reversal.
It typically appears after rising prices or at a local peak, indicating that the structural strength of the rally may be deteriorating.
Key Structural Components of Hanging Man Pattern
To separate a true Hanging Man from standard market noise, the candle must meet specific geometric criteria:
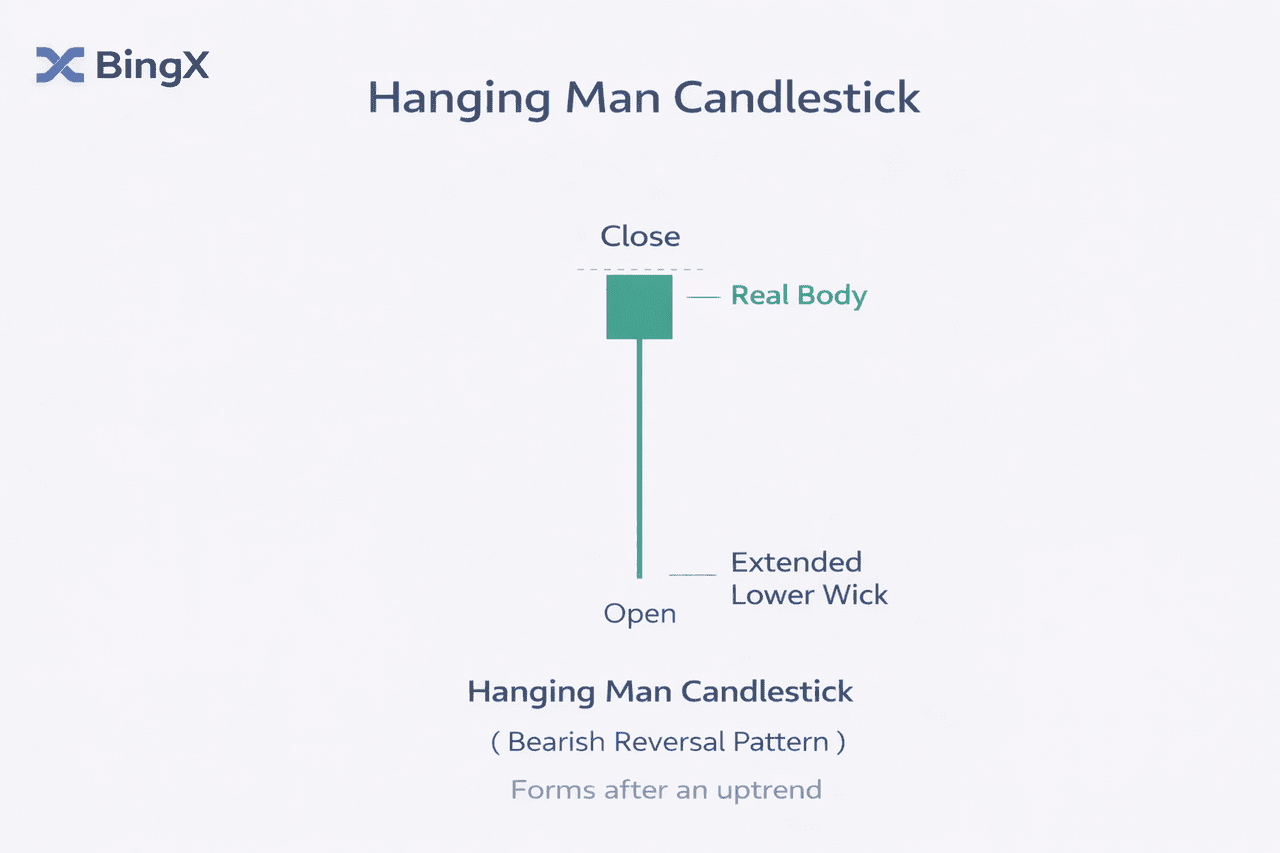
• Small Real Body: The difference between the opening and closing prices is narrow, forming a compact body near the top of the session’s trading range.
• Long Lower Shadow: The lower wick must be at least twice the length of the real body. This shows strong intraday selling pressure.
• Minimal Upper Shadow: There should be little to no upper wick, meaning the session high occurred near the open or close.
• Color Neutrality: The candle may be red or green. A red Hanging Man is slightly more aggressive, but both variations remain valid signals.
How to Identify a Hanging Man Candlestick on the Chart
Before labeling a candle as a Hanging Man, confirm:
• Was there a clear sustained uptrend before it formed?
• Is the real body positioned at the top of the candle’s range?
• Is the lower shadow at least twice the body size?
• Is the upper wick small or non-existent?
• Is the pattern appearing near resistance or after an extended rally?
Without prior upward momentum, the pattern loses its meaning.
What Is the Psychology Behind the Hanging Man Pattern: The Hidden Struggle
The Hanging Man reflects a shift in market dynamics.
During the session, sellers manage to push prices sharply lower, creating the long lower shadow. This proves that bears are strong enough to break intraday support. Although buyers recover the price by the close, the rally is no longer one-sided.
Key interpretations:
• Bullish dominance is weakening.
• Selling pressure is emerging.
• The recovery into the close may be fragile.
The candle does not confirm reversal on its own. It signals vulnerability. Confirmation is required.
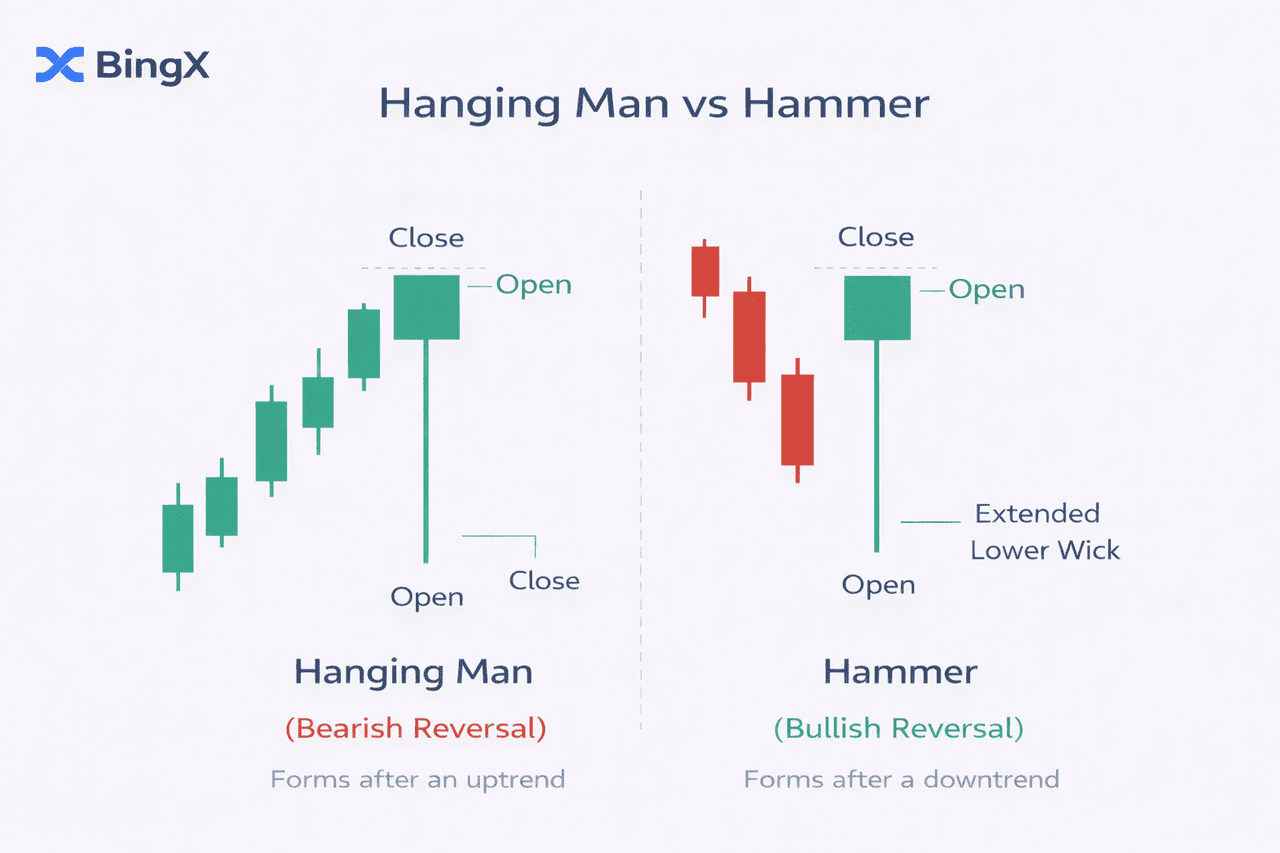
Hanging Man vs. Hammer Candlestick Pattern: Context Is Everything
Visually, the Hanging Man and Hammer are identical. Both have small real bodies and long lower shadows.
The difference lies entirely in location.
• A Hammer forms after a downtrend and signals potential bullish reversal.
• A Hanging Man forms after an uptrend and signals potential bearish reversal.
Trading these patterns without analyzing prior price action leads to costly mistakes. In candlestick analysis, context determines meaning.
| Feature | Hanging Man | Hammer |
| Trend Context | Sustained Uptrend | Sustained Downtrend |
| Signal Type | Bearish Reversal | Bullish Reversal |
| Market Psychology | Sellers are emerging | Buyers are stepping in |
| Price Action | Potential Top | Potential Bottom |
Confirmation: When Does the Hanging Man Pattern Become Tradable?
A Hanging Man in isolation is only a warning. To avoid false signals, traders must wait for confirmation. A bearish reversal is confirmed when:
• The next candle closes below the Hanging Man’s low.
• Trading volume increases on the confirmation candle.
• Price breaks a nearby support level.
• Momentum indicators such as RSI (relative strength index) show divergence.
• A bearish MACD (moving average convergence divergence) crossover appears.
If the next candle closes above the Hanging Man’s high, the pattern is invalidated. False signals are common in sideways markets. Confirmation separates high-probability setups from noise.
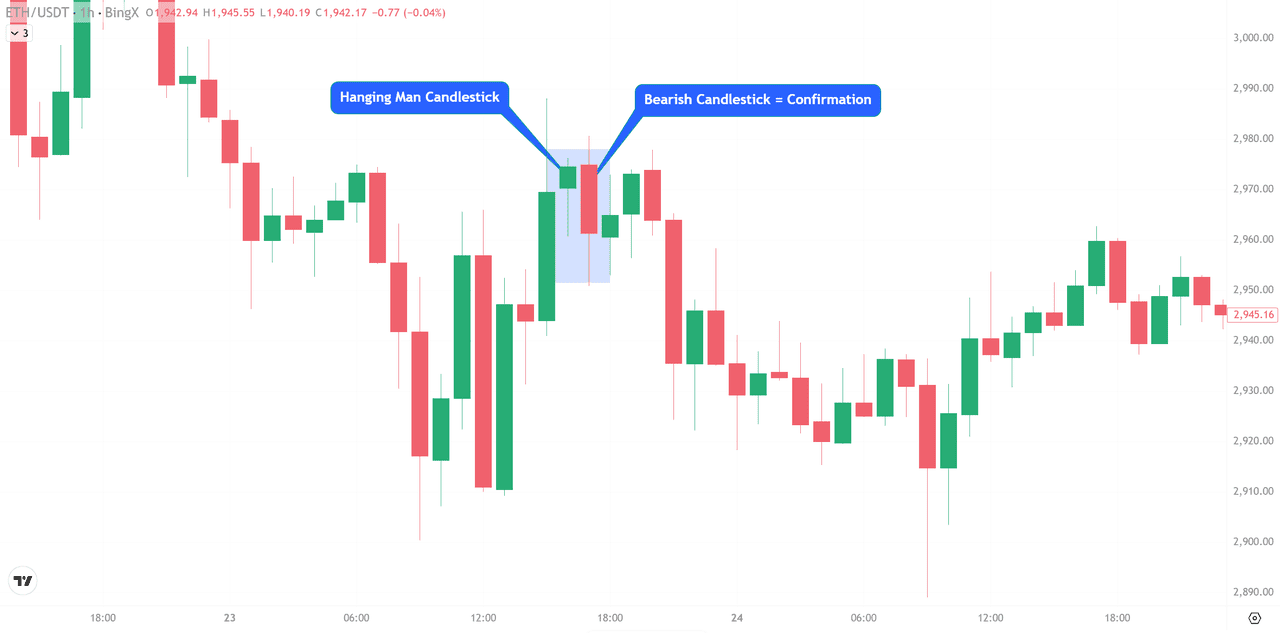
Ethereum (ETH/USDT) Price Chart - Source: BingX
For example: As seen in the ETH/USDT chart on BingX, a green Hanging Man formed near the $2,980 level following a sharp recovery. While the long lower shadow showed buyer resilience, savvy traders waited for the next hour. The subsequent red bearish candle closed decisively below the Hanging Man's low, confirming the reversal and leading to a price drop toward $2,910.
How to Trade the Hanging Man Trading Strategy: Step-by-Step Guide
Turning a visual pattern into a profitable trade requires a systematic approach. By following these steps, you can filter out market noise and execute trades based on objective data rather than emotion.
Step 1: Identify Market Structure
Before looking for a specific candle, confirm the environment. The Hanging Man is only valid in a sustained upward trend. Check for a series of higher highs and higher lows to ensure the bulls have been in control.
Step 2: Spot the Hanging Man Formation
Identify the candle with a small body near the top of its range and a long lower shadow (at least twice the body's length). It must appear after rising prices to be considered a potential reversal signal.
Step 3: Wait for Confirmation Candle
Patience is key. You must wait for a bearish candlestick to close decisively below the low of the Hanging Man. This confirms that the bears have successfully overwhelmed the previous buying pressure.
Step 4: Entry Strategy
• Aggressive Entry: Enter a short position immediately after the confirmation candle closes.
• Conservative Entry: Wait for a minor retracement back toward the Hanging Man’s low to get a better price before entering.
Step 5: Stop-Loss Placement
To protect your capital, place your stop-loss above the Hanging Man’s high or above the most recent swing high. This ensures that if the trend continues upward, your loss is capped.
Step 6: Take Profit Targets
Aim for the next major support zone or a key Fibonacci retracement level. Ensure your trade maintains a minimum risk-reward ratio of 1:2.
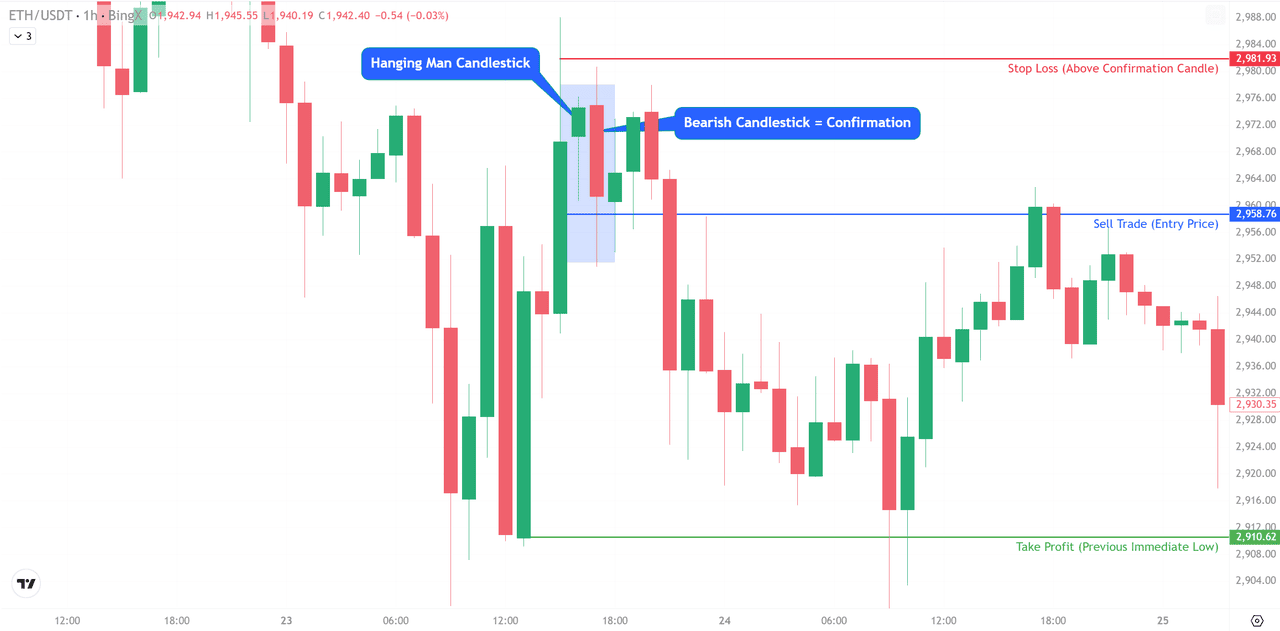
Ethereum (ETH/USDT) Price Chart - Source: BingX
On the ETH/USDT chart, a green Hanging Man formed near $2,980 after a strong upward move. The long lower shadow showed intraday selling pressure.
The next candle closed below the Hanging Man’s low around $2,958, confirming the bearish reversal.
• Entry: Short near $2,958
• Stop-Loss: Above $2,981
• Take Profit: Near previous support around $2,910
The structured approach captured the move from $2,958 to $2,910, demonstrating how confirmation transforms a visual signal into a disciplined trade.
How to Use Other Technical Indicators with the Hanging Man
Relying on a single candle is risky; professional traders use confluence to increase trade probability. By layering the Hanging Man with secondary tools, you verify if the price action is backed by broader market data.
• EMA Lines: Prices trading under Exponential Moving Averages (EMA) confirm dominant selling pressure.
• RSI: An RSI value > 50 that begins hooking downward suggests a potential sell trade as bullish momentum fades.
• Support and Resistance: Reversals are high-conviction when they occur at established resistance levels.
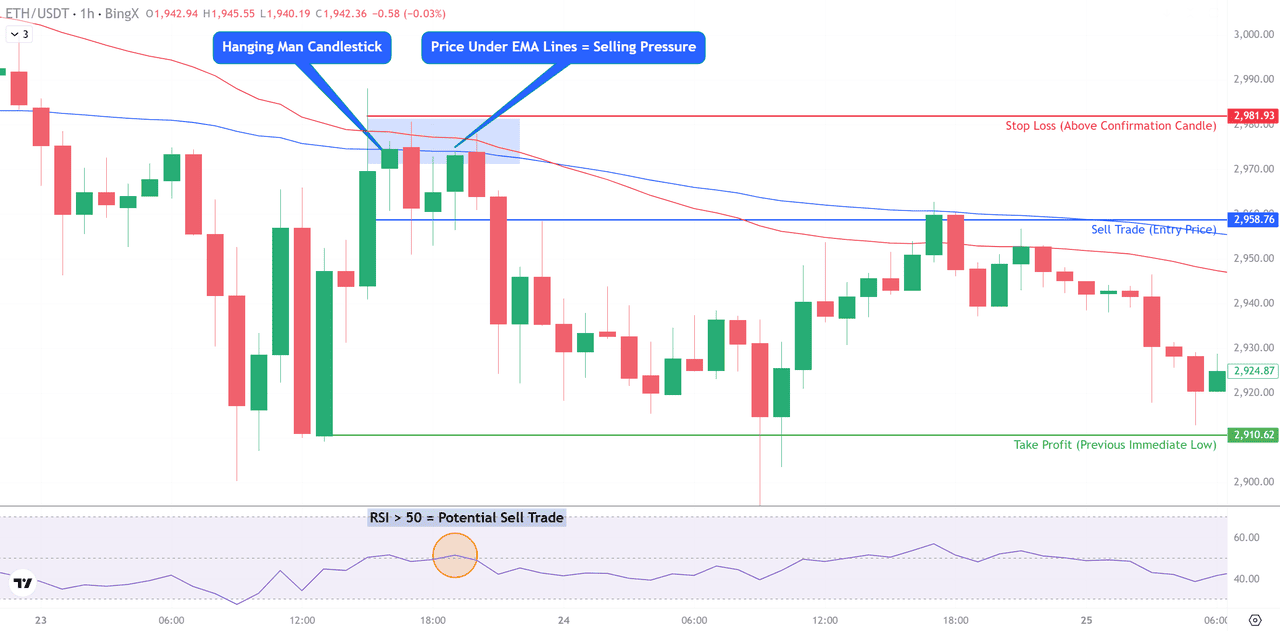
Confluence in Action: ETH/USDT Example
As shown in the BingX example, the Hanging Man was validated by multiple signals:
1. Price Action: Stayed under the EMA lines, proving sellers were defending the upside.
2. Momentum: The RSI confirmed the rally was overextended.
3. Entry Point: A sell trade was executed at $2,958.76 after the bearish confirmation candle closed below the Hanging Man's low.
Common Mistakes Traders Make When Trading the Hanging Man Pattern
Even the most experienced analysts can fall into traps when trading the Hanging Man. Understanding these common pitfalls is essential for maintaining a high win rate:
• Trading Without Confirmation: Entering a short position immediately after the pattern forms is a gamble. Without a bearish close below the wick, the price often continues its upward trajectory.
• Ignoring Trend Context: A Hanging Man is only valid at the peak of an uptrend. In a sideways or "choppy" market, the pattern loses its predictive power and frequently produces false signals.
• Misidentification: Traders often mistake a Hammer (bullish) for a Hanging Man (bearish). Remember: location is everything, one occurs at the bottom, the other at the top.
• Poor Risk Management: Placing a stop-loss too tight or ignoring overall market direction can lead to unnecessary liquidations.
Risk Management When Trading the Hanging Man
Even high-probability setups can fail. Protecting capital is non-negotiable.
• Risk no more than 1–2% of total account balance per trade.
• Calculate position size based on stop-loss distance.
• Avoid emotional decision-making.
• Never trade a single pattern in isolation.
Risk control ensures that one failed setup does not erase weeks of progress.
Conclusion: Turning Reversal Signals into Structured Trades
The Hanging Man does not predict collapse. It signals vulnerability within an uptrend. Success comes from discipline: waiting for bearish confirmation, applying indicator confluence, and enforcing strict risk management. When integrated into a structured trading plan, the Hanging Man becomes more than a candlestick shape. It becomes an actionable reversal framework.
Ready to apply it in live markets? Open your BingX charts and start identifying confirmed Hanging Man setups using real-time price action and professional technical tools.
Related Reading
FAQ on Hanging Man Candlestick Pattern
1. Is the Hanging Man candlestick pattern always bearish?
No. The Hanging Man is a potential bearish reversal signal, not a guaranteed one. It only becomes tradable after a confirmation candle closes below its low. Without confirmation, the pattern can fail and price may continue rising.
2. Can a green Hanging Man still signal a reversal?
Yes. A green Hanging Man is still valid. While a red candle is slightly more aggressive because it closes lower than it opens, both red and green Hanging Man candles can indicate weakening bullish momentum. Context and confirmation matter more than color.
3. What timeframe works best for trading the Hanging Man?
The pattern tends to be more reliable on higher timeframes such as the 4-hour and daily charts. Lower timeframes can produce more false signals due to market noise and short-term volatility.
4. What confirms a Hanging Man reversal?
A valid confirmation includes:
• A bearish candle closing below the Hanging Man’s low
• Increased trading volume
• A break of nearby support
• Bearish signals from RSI or MACD
Without these, the pattern remains only a warning.
5. What is the difference between a Hanging Man and a Hammer?
Structurally, they are identical. The difference lies in location:
• A Hammer forms after a downtrend and signals potential bullish reversal.
• A Hanging Man forms after an uptrend and signals potential bearish reversal.
Market context determines the meaning.
6. Can the Hanging Man produce false signals?
Yes. False signals are common in sideways or choppy markets. That is why confirmation and broader technical analysis are essential before entering a trade.
7. Where should I place my stop-loss when trading the Hanging Man?
The stop-loss is typically placed above the Hanging Man’s high or above the most recent swing high. This protects against invalidation if the uptrend resumes.
8. Is the Hanging Man suitable for crypto trading?
Yes. The Hanging Man pattern works across financial markets, including crypto, forex, stocks, and commodities. However, due to crypto volatility, strict risk management and confirmation rules are even more important.